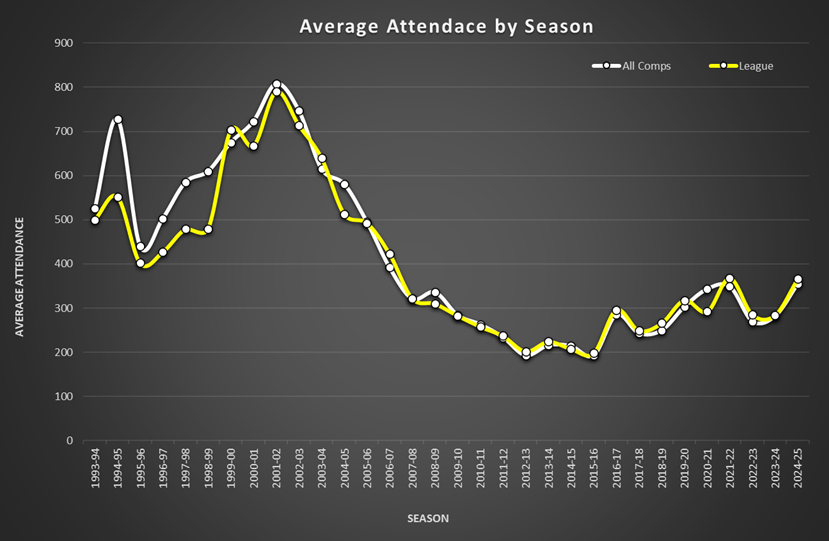
The tables below show the average home attendances in all competitions (white), and league only (yellow), with the percentage change from the previous season. Attendance data is available from the 1993/94 season onwards.
| Season | All Comps | % Change | League | % Change |
|---|---|---|---|---|
| 1993/94 | 525 | x | 500 | x |
| 1994/95 | 728 | 38.67 | 552 | 10.40 |
| 1995/96 | 440 | -39.56 | 402 | -27.17 |
| 1996/97 | 503 | 14.32 | 427 | 6.22 |
| 1997/98 | 585 | 16.30 | 479 | 12.18 |
| 1998/99 | 610 | 4.27 | 480 | 0.21 |
| 1999/00 | 675 | 10.66 | 703 | 46.46 |
| 2000/01 | 723 | 7.11 | 667 | -5.12 |
| 2001/02 | 808 | 11.76 | 790 | 18.44 |
| 2002/03 | 747 | -7.55 | 714 | -9.62 |
| 2003/04 | 615 | -17.67 | 640 | -10.36 |
| 2004/05 | 581 | -5.53 | 513 | -19.84 |
| 2005/06 | 495 | -14.80 | 493 | -3.90 |
| 2006/07 | 392 | -20.81 | 423 | -14.20 |
| 2007/08 | 321 | -18.11 | 322 | -23.88 |
| 2008/09 | 336 | 4.67 | 310 | -3.73 |
| 2009/10 | 284 | -15.48 | 283 | -8.71 |
| 2010/11 | 263 | -7.39 | 258 | -8.83 |
| 2011/12 | 234 | -11.03 | 237 | -8.14 |
| 2012/13 | 193 | -17.52 | 202 | -14.77 |
| 2013/14 | 216 | 11.92 | 224 | 10.89 |
| 2014/15 | 214 | -0.93 | 208 | -7.14 |
| 2015/16 | 193 | -9.81 | 198 | -4.81 |
| 2016/17 | 285 | 47.67 | 296 | 49.49 |
| 2017/18 | 243 | -14.74 | 249 | -15.88 |
| 2018/19 | 250 | 2.88 | 266 | 6.83 |
| 2019/20 | 303 | 21.20 | 318 | 19.55 |
| 2020/21 | 343 | 13.20 | 292 | -8.18 |
| 2021/22 | 349 | 1.75 | 368 | 26.03 |
| 2022/23 | 270 | -22.64 | 285 | -22.55 |
| 2023/24 | 282 | 4.44 | 284 | -0.35 | 2024/25 | 355 | 25.89 | 366 | 28.87 |